
Figure 5.
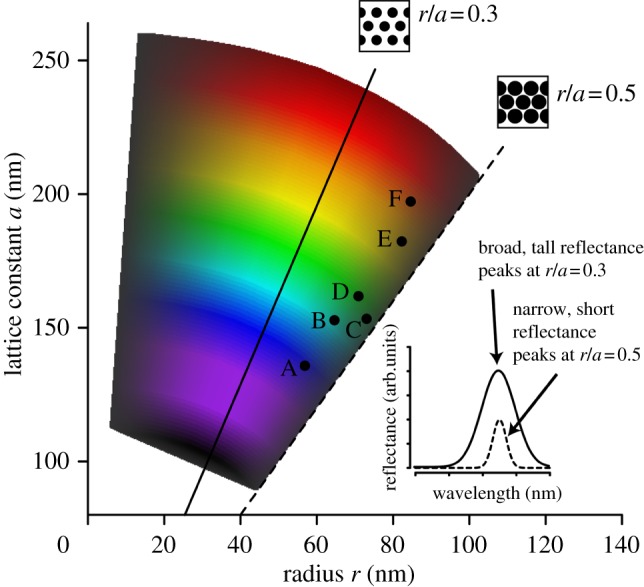
Theoretically possible colours of two-dimensional photonic crystal structure in ducks compared with observed values. Coloured polygon depicts simulated band gap sizes (lightness of colour) and hues (shade of colour) for a range of possible values for melanosome radius and lattice constant, showing a maximum band gap at r/a = 0.3 (solid line) and a minimum at r/a = 0.5 (the close-packing limit; dashed line). Labelled points represent observed nanostructural dimensions (same values used in figure 2) for six species of duck: A. platyrhynchos (A), Amazonetta brasiliensis (B), Anas carolinensis (C), A. clypeata (D), A. acuta (E) and Speculanas specularis (F). Schematic drawings show melanosome configurations (black circles) at r/a = 0.3 and 0.5; inset shows hypothetical reflectance curves for each configuration.