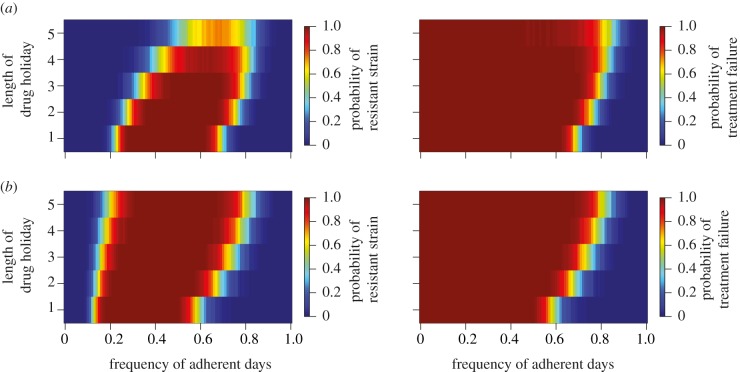
Figure 3.
The plots show the length of a drug holiday over the frequency of adherent days. For the plots in the left column, red indicates a high probability of the emergence of a fully resistant strain. In the right column, red indicates a higher probability of treatment failure due to insufficient viral suppression. (a) Effect of drug holidays on treatment outcome under the standard parameters and drug half-lives of 12 h each. (b) Effect of drug holidays with a treatment regimen replacing one drug with another which has a half-life of 24 h.

