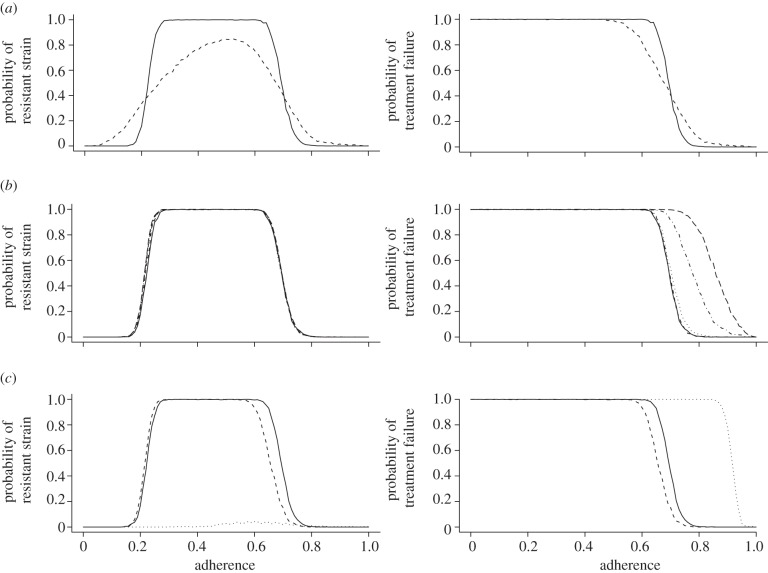
Figure 4.
The plots in the left column show the probability of the emergence of a fully resistant strain over the level of adherence. The plots in the right column show the probability of treatment failure due to insufficient viral suppression over the level of adherence. (a) Effect of the random assignment of resistance costs (solid lines, 0.2; dashed lines, random 0–0.5). (b) Effect of different detection intervals between viral assessments (solid lines, 120 days; short dashed lines, 60 days; dotted lines, 30 days; dashed-dotted lines, 7 days; long dashed lines, 1 day). (c) Effect of different fractions of latently infected cells. The standard values for f1 and f2 are 10−2 and 10−4, respectively (solid lines, standard; dashed lines, fn × 0.1; dotted lines, fn × 10).

