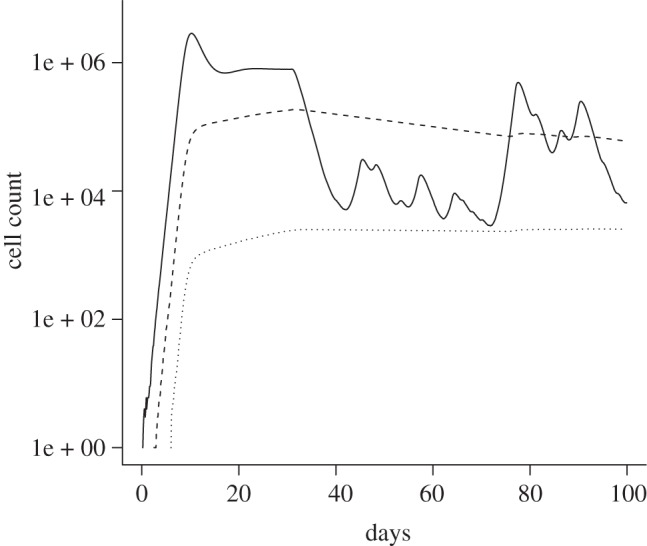
Figure 7.

Cell populations (solid lines, infected cells; dashed lines, latently infected cells; dotted lines, slow latently infected cells) in an example patient, which is 60% adherent. The treatment starts at day 30. No discrimination is being made between genotypes. All other parameters are as described in table 1.
