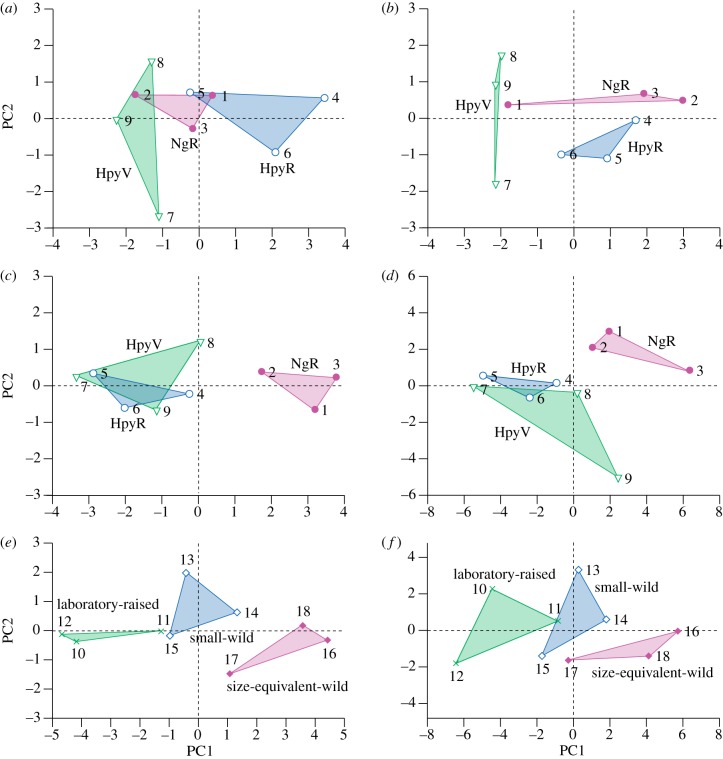
Figure 2.
Results of principal components analysis, first two axes. (a) Oral teeth, two-dimensional data, 100 µm sampling area, all two-dimensional variables (feature mean length, s.d. of length, feature mean width, s.d. of width, preferred orientation, R and feature density.) PC1 accounts for 49% of the variance, with all the variables derived from scratch dimensions loading approximately equally and positively (eigenvectors of 0.47–0.48). PC2, accounts for 22% of the variance, and reflects the two variables derived from scratch orientation (eigenvectors: preferred orientation = 0.72; R = −0.54). (b) Oral teeth, two-dimensional data, 300 µm sampling area; all two-dimensional variables. PC1 accounts for 58% of the variance, and all the variables derived from scratch dimensions load approximately equally and positively (eigenvectors of 0.40–0.45), while preferred orientation and feature density load negatively (−0.37, −0.32, respectively). PC2, accounting for 18% of the variance, reflects strong positive loading of R (0.83) and negative loading of feature mean length and s.d. of length. (c) Oral teeth, three-dimensional data, parameters that differ (ANOVA). All seven parameters (Sa, Sk, Spk, Vmp, Vmc, Vvc and Sal) load approximately equally on PC1 (eigenvectors of 0.33–0.39) which accounts for 93% of variance. (d) Oral teeth, three-dimensional data, all parameters. PC1 (60% of variance) reflects heaviest loading of the following parameters (>2.4, Sq, Sdr, Svk, Vvv, Sv(log), Sz(log). PC2 (21% of variance) reflects positive loadings (2.5–3.0) of Smr2, Sal and Std, and negative loadings (−2.5 to −3.7) of Ssk, Sku and Sdq. (e) LPJ teeth, three-dimensional data (log), parameters that differ (ANOVA). Most parameters (Sa, Sq, Sk, Spk, Vmp, Vmc, Vvc, Vvv and Svk) load equally and positively on PC1, with eigenvectors of 0.3 or above; the loading of Sal is less, and the loading on Smr2 is negative. (f) LPJ teeth, three-dimensional data (log), all parameters. The first two axes account for 82% of variance; 15 parameters load approximately equally on PC1, with eigenvectors of between 0.23 and 0.26. Key to specimen numbers: 1 = NgR92, 2 = NgR101, 3 = NgR104, 4 = HpyR118, 5 = HpyR163, 6 = HpyR205, 7 = HpyV01, 8 = HpyV02, 9 = HpyV03, 10 = 37864, 11 = 37865, 12 = 37866, 13 = 37867, 14 = 37868, 15 = 37869, 16 = 37870, 17 = 37871, 18 = 37872.

