
Figure 3.
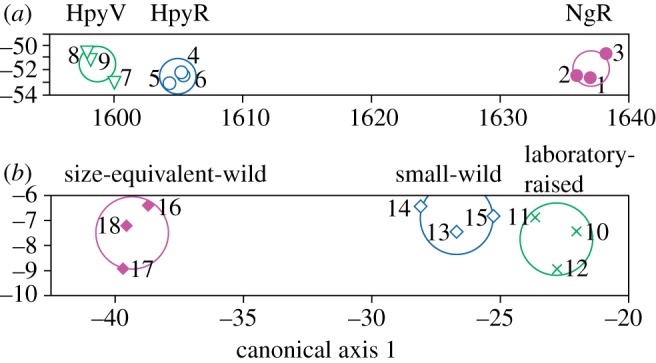
Results of stepwise linear discriminant analysis of three-dimensional roughness data. (a) Oral teeth: three microtextural parameters—Spk, Svk and Smr2—are enough to assign specimens to their correct trophic groups (canonical axis 1 explains 99.94% of variance; scores for axis 1 are correlated with Spk; scores for axis 2 are correlated with Svk and Smr2; see the electronic supplementary material). (b) Lower pharyngeal teeth: three microtextural parameters—Svk, Smr1 and Str—are enough to assign specimens to their correct trophic groups (canonical axis 1 explains 99.77% of variance, axis 2 the remaining 0.23%; scores for axis 1 are correlated with Svk; scores for canonical axis 2 are correlated with Str. Circles are 95% confidence limits for the means. Numbers refer to specimens (figure 2).