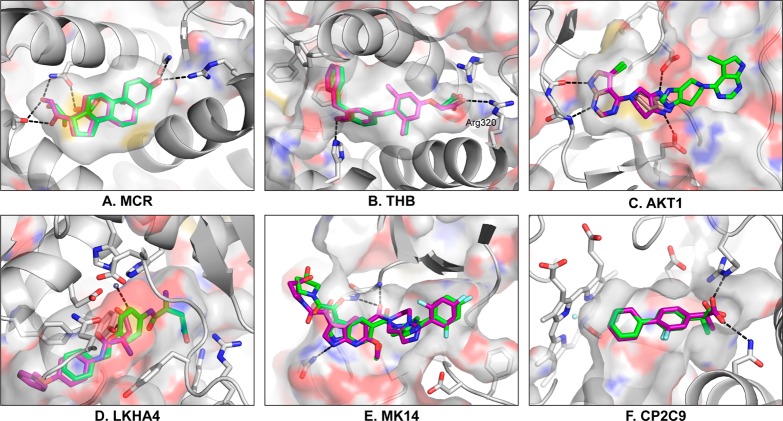
Figure 6.
Representative docking poses. The crystallographic ligand was rebuilt and docked from scratch. (A–F) The crystal pose (magenta) is compared to the resulting docked pose (green). In (C), more ligand conformations are generated and the redocked pose is also shown (tan). Key hydrogen bonds are shown by black dotted lines, and the partially transparent protein surface is colored by atom type.

