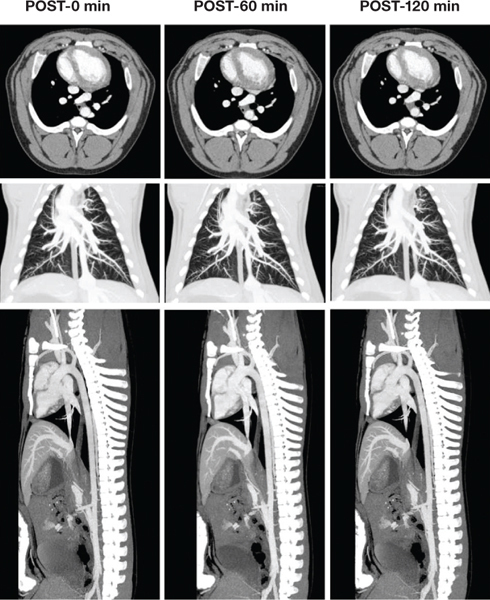
Figure 4.
Simultaneous visualization of pulmonary vasculature, heart, and descending aorta in a sheep model. Top row: axial images demonstrating uniform and stable attenuation in cardiac chambers. Middle row: coronal thick slab maximum intensity projection (MIP) images demonstrating the pulmonary vasculature. Bottom row: sagittal thick slab MIP images demonstrating the descending aorta. Images were acquired at various time points after a single injection of liposomal blood pool contrast agent.