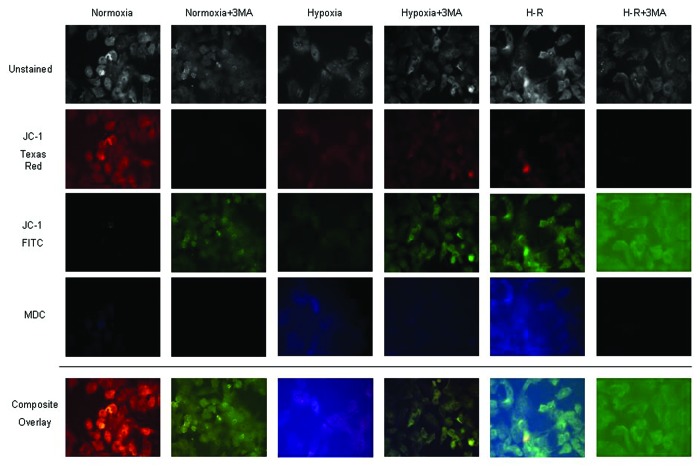
Figure 9. Autophagy is primarily performed in mitochondrion in human hepatocytes during hypoxia and H-R. This figure demonstrates the effects of hypoxia and H-R upon human hepatocyte mitochondrial membrane potential and MDC staining. Mitochondrial membrane potential was determined using the specific dye JC-1. When mitochondrial membrane potential is normal JC-1 appears red but once membrane potential is lowered or lost the dye become green. MDC staining is detected within the DAPI channel and appears blue. Composite overlay images are shown at the bottom of the figure. Additionally unstained images are provided with stained images to highlight the cellular location of immunofluorescence. In normoxia, as expected there was a normal mitochondrial membrane potential and no autophagy noted. During hypoxia and H-R there was a progressive loss of red JC-1 staining and an increase in green JC-1 staining indicating loss of mitochondrial potential and onset of cell death. In addition there was an increase in MDC staining in human hepatocytes during hypoxia and H-R. Moreover, MDC staining and green JC-1 staining co-localized in human hepatocytes during hypoxia and H-R.

An official website of the United States government
Here's how you know
Official websites use .gov
A
.gov website belongs to an official
government organization in the United States.
Secure .gov websites use HTTPS
A lock (
) or https:// means you've safely
connected to the .gov website. Share sensitive
information only on official, secure websites.
