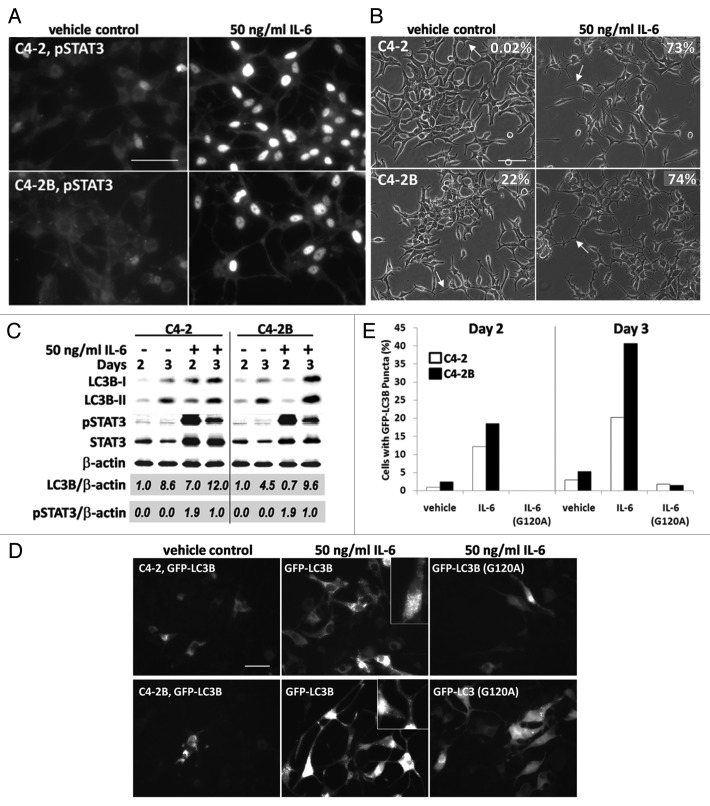
Figure 3. IL-6 induces accumulation of LC3B and GFP-LC3 puncta in C4-2 or C4-2B cells. (A) C4-2 (top) and C4-2B (bottom) cells were treated with 50ng/ml IL-6 protein for 2 d and immunostained for phospho-STAT3 (Alexa Fluor 488, 63x magnification, scale bar = 50 μm). (B) C4-2 (top) and C4-2B (bottom) cells were treated with IL-6 protein for 2 d and imaged using brightfield (20x magnification, scale bar = 100 μm). Arrows points to examples of cell process extension/branching. For each treatment, the percentage of cells displaying cell process extension and/or branching was determined for 3 microscopy fields, n = 178–282 total cell count, and percentage is denoted on the image. (C) C4-2 and C4-2B cells were treated with 50 ng/ml IL-6 protein for 2 and 3 d. Total protein was isolated from cells and analyzed by western blot for LC3B, phospho-STAT3, and STAT3 accumulation. β-actin is a loading control. Densitometry was used to measure protein band intensity. Total LC3B and phospho-STAT3 accumulation were normalized to β-actin (LC3B/β-actin, pSTAT3/β-actin). LC3B levels were calculated relative to vehicle control, day 2 and phospho-STAT3 levels were calculated relative to IL-6 treatment, day 3. (D and E) C4-2 and C4-2B cells transiently expressing GFP-LC3B or GFP-LC3B (G120A) transgenes were treated with 50 ng/ml IL-6 protein for 2 and 3 d. (D) Image, C4-2 (top) and C4-2B (bottom) cells were imaged at day 3 using fluorescence microscopy (FITC, 40x magnification, scale bar = 50 μm). (E) Graph, The percentage of cells with GFP-LC3 puncta was calculated for 3–7 microscopy fields and graphed, n = 91–548 total cell count.

An official website of the United States government
Here's how you know
Official websites use .gov
A
.gov website belongs to an official
government organization in the United States.
Secure .gov websites use HTTPS
A lock (
) or https:// means you've safely
connected to the .gov website. Share sensitive
information only on official, secure websites.
