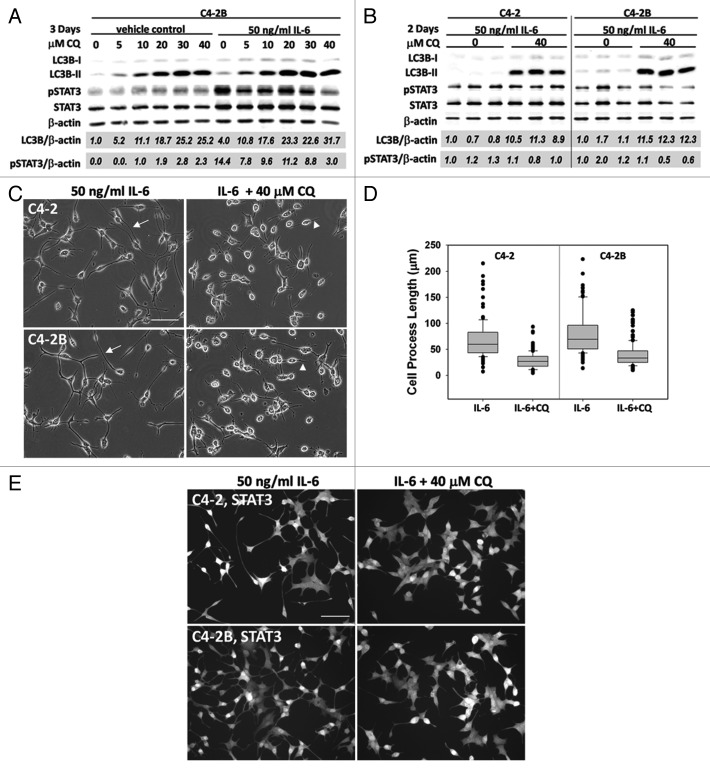
Figure 6. Pharmacological inhibition of autophagy flux blocks IL-6-induced C4-2 and C4-2B NED morphology. (A) Chloroquine (CQ) dose sensitivity was determined using C4-2B cells treated with 50 ng/ml IL-6, or vehicle control, in the presence of 0–40 μM CQ for 3 d. Total protein was isolated and analyzed by western blot and normalized to β-actin loading control. Total LC3B and phospho-STAT3 accumulation were normalized to β-actin (LC3B/β-actin, pSTAT3/β-actin). LC3B or phospho-STAT3 levels were calculated relative to the vehicle control, 0 μM CQ or vehicle control, 10 μM CQ, respectively. (B–D) C4-2 and C4-2B cells were treated with 50 ng/ml IL-6 ± 40 μM CQ for 2 d. (B) Western blot, 3 biological replicates were analyzed by western blot. Total LC3B and phospho-STAT3 were normalized to β-actin and levels calculated relative to the first biological replicate of the 0 μM CQ control. LC3B, p value = 2^-04 (C4-2) or 5^-06 (C4-2B), phospho-STAT3, p value = 0.23 (C4-2) or 0.15 (C4-2B). (C) Image, C4-2 (top) and C4-2B (bottom) cells were imaged in brightfield (20x magnification, scale bar = 100 μm). Arrows point to examples of cell process extension/branching. Arrowheads point to examples of shortened cell processes. (D) Graph, the longest process extension per cell was measured using Image J, n = 116–164 cells measured, p value, 2^-21 (C4-2) or 5^-19 (C4-2B). (E) C4-2 and C4-2B cells treated with 50 ng/ml IL-6 for 1 d, followed by treatment with 40 μM CQ for 2 d. Cells were then fixed and immunostained for total STAT3 (Alexa Fluor 488, 20x magnification, scale bar = 100 μm).

An official website of the United States government
Here's how you know
Official websites use .gov
A
.gov website belongs to an official
government organization in the United States.
Secure .gov websites use HTTPS
A lock (
) or https:// means you've safely
connected to the .gov website. Share sensitive
information only on official, secure websites.
