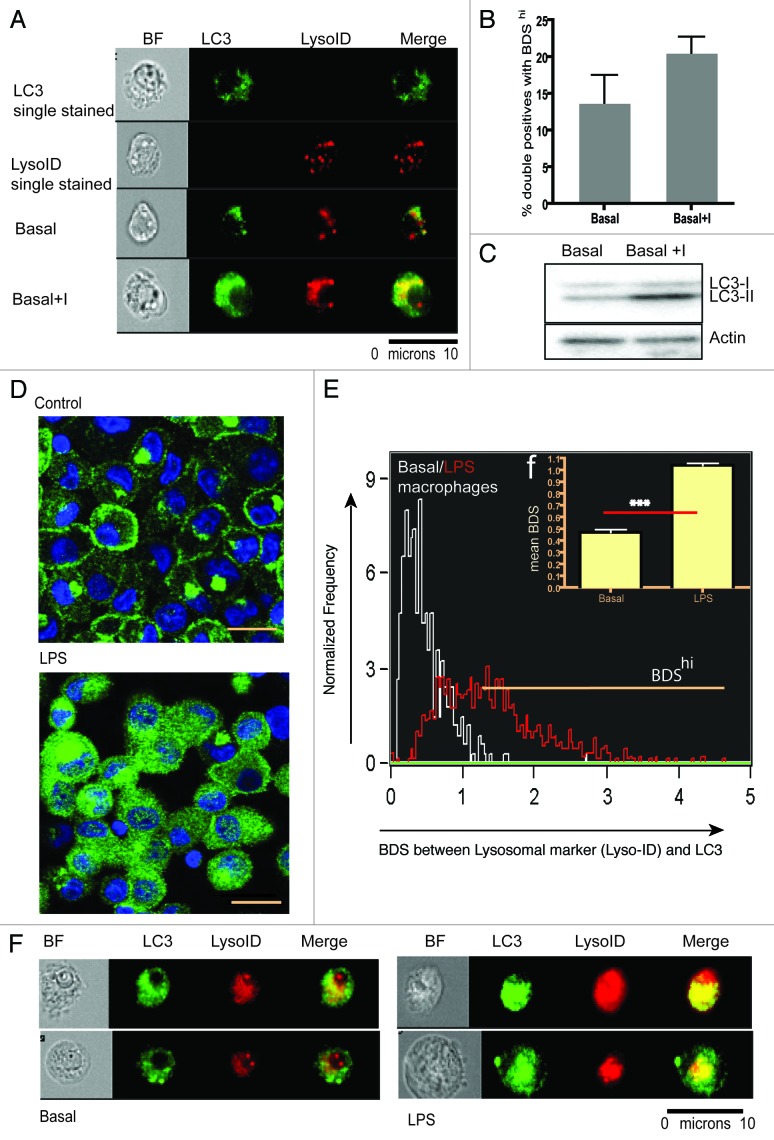
Figure 1. Basal autophagy levels in HEK293 cell line and monocyte-derived macrophages by conventional LC3 western blot, confocal microscopy and ImageStream. HEK293 cells were cultured in nutrient-rich medium with or without E64d/PepA. Cells were split into two aliquots, (A) representative ImageStream images of cells, either single stained (upper panels), or stained for both markers (bottom panels), without and with E64d/PepA (B) BDS histograms of gated double positive cells in basal medium or basal medium plus lysosomal inhibitors (Bar graph represents mean of triplicates ± SEM). (C) Western blot for LC3-I to LC3-II conversion for the same sample (D) Confocal images of monocyte-derived macrophages cultured in medium (upper panel) or treated with LPS (lower panel) (scale bar = 10 μm). (E) BDS overlay of monocyte-derived macrophages cultured in medium (white line) or treated with LPS (red line). (F) Mean BDS histogram on technical replicates for monocyte derived macrophages on (E) (***p < 0.0001). (F) Merged images of two representative cells/condition of monocyte-derived macrophages showing from left to right: bright field, LC3 (green), Lyso-ID (red) and a merge of LC3 and Lyso-ID.

An official website of the United States government
Here's how you know
Official websites use .gov
A
.gov website belongs to an official
government organization in the United States.
Secure .gov websites use HTTPS
A lock (
) or https:// means you've safely
connected to the .gov website. Share sensitive
information only on official, secure websites.
