
Figure 4.
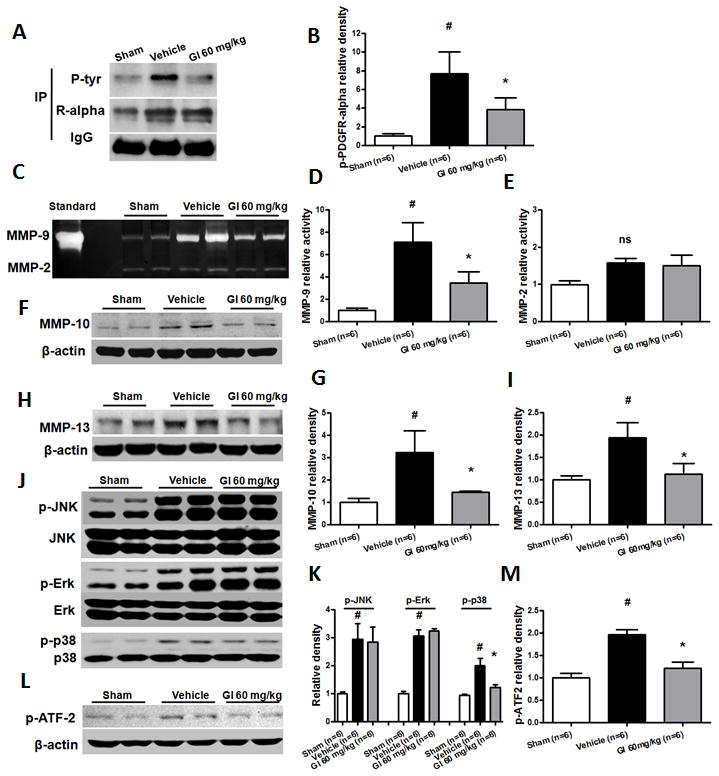
Characterization of PDGFR-α pathway at 6 hours following bICH in mice. PDGFR-α antagonist, Gleevec (60 mg/kg) was administered 1 hour following bICH. (A) Immunoprecipitation assay (IP) for phosphor-PDGFR-α level with phosphotyrosine-specific antibody (P-tyr) in the ipsilateral hemisphere in sham, vehicle and Gl treatment (60 mg/kg) mice. The precipitated protein was also visualized with PDGFR-α-specific antibodies (R-alpha). IgG was visualized as a loading control. (C) Gelatin zymography assay for MMP-9 and MMP-2 activity in the ipsilateral hemisphere in sham, vehicle and Gl treatment (60 mg/kg) mice; Western blot assay for MMP-10 (F), MMP-13 (H), JNK/p-JNK, Erk/p-Erk and p38/p-p38 (J), p-ATF-2 (L) in the ipsilateral hemisphere in sham, vehicle and G1 treatment (60 mg/kg) mice. Quantification of A, C, F, H, J, and L is shown in B, D, E, G, I, K, and M, respectively, n = 6 mice per group. Error bars represent mean ± standard error of the mean. # p < 0.05 vs Sham; * p < 0.05 vs Vehicle; ns indicates not significant.