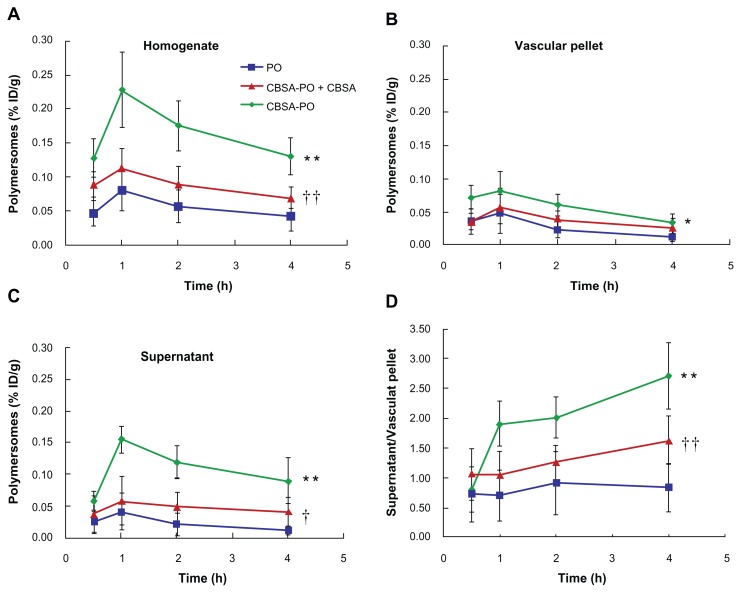
Figure 6.
Polymersome concentrations (% ID/g) versus time curves in the rat brain fractions after intravenous injection of 10 mg/kg of PO, CBSA-PO, and CBSA-PO plus 10 mg/kg of free CBSA. Data are presented as the mean ± standard deviation of n = 4 rats/point. (A) Whole homogenate, (B) vascular pellet, (C) supernatant, and (D) ratio of polymersomes concentrations in the supernatant to those in the vascular pellet.
Notes: Statistically significant differences by Student’s t-test when compared with the corresponding value of control: *P < 0.05; **P < 0.01 versus PO; †P < 0.05; ††P < 0.01 versus CBSA-PO.
Abbreviations: PO, polymersomes; CBSA, cationic bovine serum albumin.

