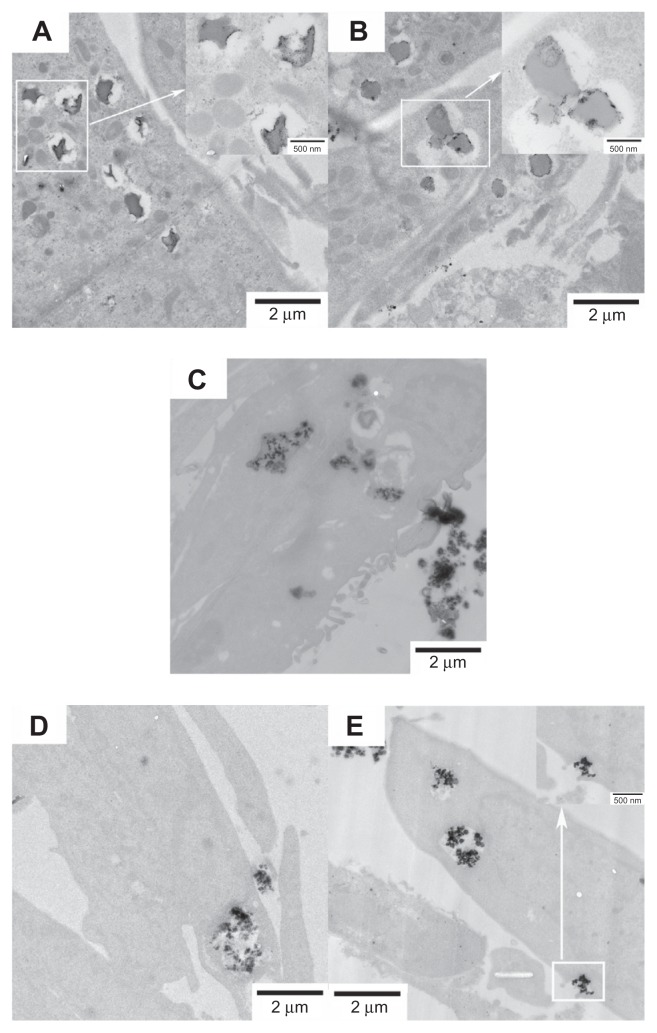
Figure 8.
Representative TEM images showing the uptake of FePt NPs with different components and surface coatings by human glioma U251 cells at the exposed dose of 25 μg/mL after 24 hours’ incubation.
Notes: (A) Fe60Pt40-OA/OA; (B) Fe45Pt55-OA/OA; (C) Fe27Pt73-OA/OA; (D) Fe60Pt40-Cys; (E) Fe24Pt76-Cys. Numerous vesicles containing the aggregative FePt NPs were visible intracellularly and were dispersed randomly in the cytoplasm. The insets in panels (A and B) are enlargements of the areas marked in white, showing the aggregative FePt NPs contained in the vesicles. The inset in panel (E) is the enlargement of the area marked in white, showing the formation of a vesicle containing an aggregate of FePt NPs.
Abbreviations: TEM, transmission electron microscopy; NPs, nanoparticles; OA/OA, oleic acid/oleylamine; Cys, cysteine.

