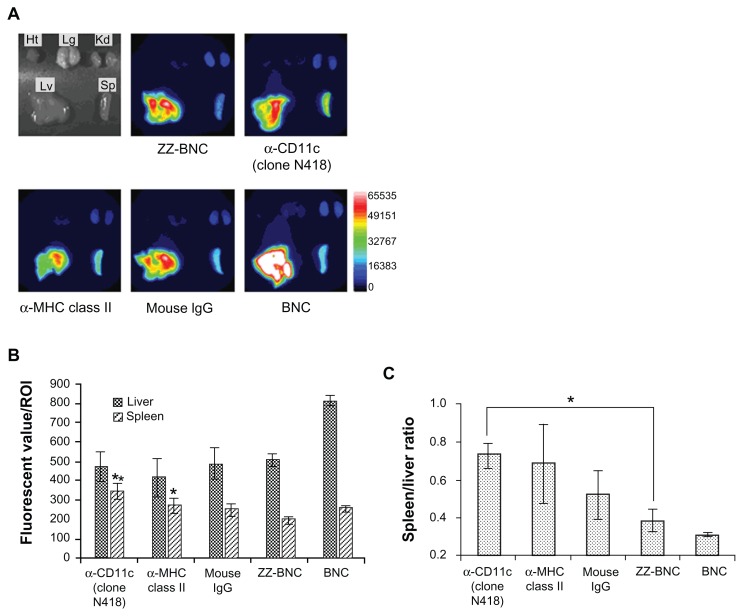
Figure 3.
In vivo distribution of CF750-labeled α-DC-ZZ-BNC complexes following intravenous injection into mice. (A) CF750-derived fluorescence in each extirpated organ was observed using an OV-100 in vivo imaging system 40 minutes after intravenous injection into mice. (B) Fluorescent values of each organ in ROI were analyzed using WASABI software. Measurements were performed in triplicate. Error bars indicate the SD; **P < 0.01; *P < 0.05. (C) Fluorescent ratio between the spleen and liver in ROI was calculated from the average fluorescent values of the spleen and liver. *P < 0.05.
Abbreviations: DC, dendritic cell; ZZ-BNC, BNC displaying ZZ domains; Ht, heart; Lg, lung; Kd, kidney; Lv, liver; Sp, spleen; ROI, region of interest; SD, standard deviation.

