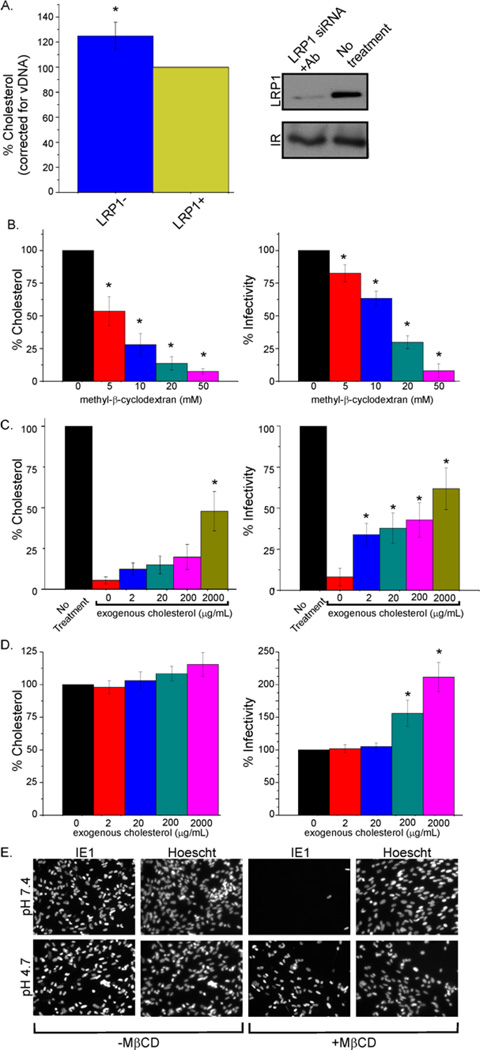
Fig. 6. Cholesterol content of virions regulates fusion with the plasma membrane.
(A) LRP1 activity correlates with virion cholesterol level: Fibroblasts were left untreated or transfected with LRP1 siRNA (24 h before infection) and then treated with LRP1 neutralizing antibody 24 h later. After an additional 1 h, cells were infected (0.1 IU/cell). Antibody was reapplied every 48 h. 10 days later, virus was collected, gradient purified, normalized for virion DNA, and assayed for cholesterol content. LRP1 plasma membrane levels were assayed by Western blot to confirm its knockdown.
(B) Depletion of virion cholesterol reduces infectivity: Gradient purified virions were either mock treated or treated with increasing concentrations of MβCD for 30 min at 37°C. Treated virus was pelleted through a sorbitol cushion to remove MβCD and infectivity was assayed by IE1 immunofluorescence.
(C) Treatment of cholesterol-depleted virions with exogenous cholesterol substantially restores infectivity: MβCD-treated (50 mM) virus was incubated with varying concentrations of cholesterol for 30 min at 37°C, pelleted through a sorbitol cushion, and infectivity was assayed.
(D) Exogenous cholesterol treatment of normal virions enhances infectivity: Purified virions were incubated in varying concentrations of cholesterol for 30 min at 37°C, pelleted through a sorbitol cushion, and infectivity was assayed.
(E) Cholesterol-depleted virions enter cells efficiently when normal membrane fusion is bypassed: Fibroblasts were infected (3 IU/cell) with MβCD-treated (50 mM) or mock-treated virus, allowed to sit at 4°C for 30 min to allow virus binding, then treated with buffer at neutral (7.4) or acidic (4.7) pH for 3 min. Cells were assayed for IE1 expression at 24 hpi.
Error bars report the standard error from three experiments with three replicates each. *P<0.001 (t-test, compared to control condition). Fig S3 contains additional data relevant to this experiment.

