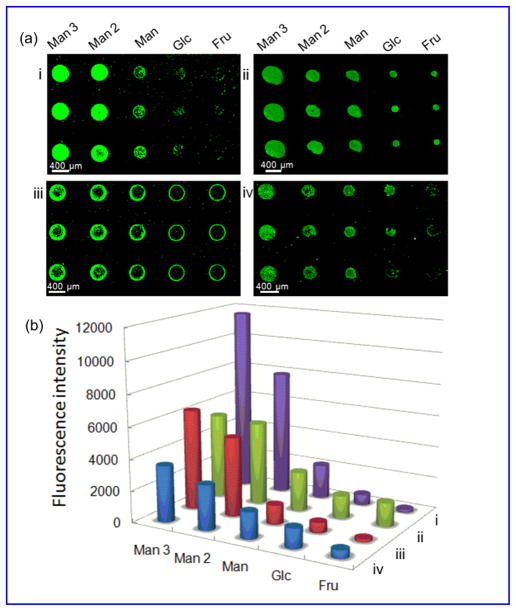
Figure 2.
(a) Fluorescence images of GNP microarrays probed with FSNP-Con A (i) or FITC-Con A (iii), and carbohydrate microarrays probed with FSNP-Con A (ii) or FITC-Con A (iv). (b) Fluorescence intensity of the four arrays in (a). Each data point was the average of the 3 spots in (a), and the error bars were omitted for clarity.

