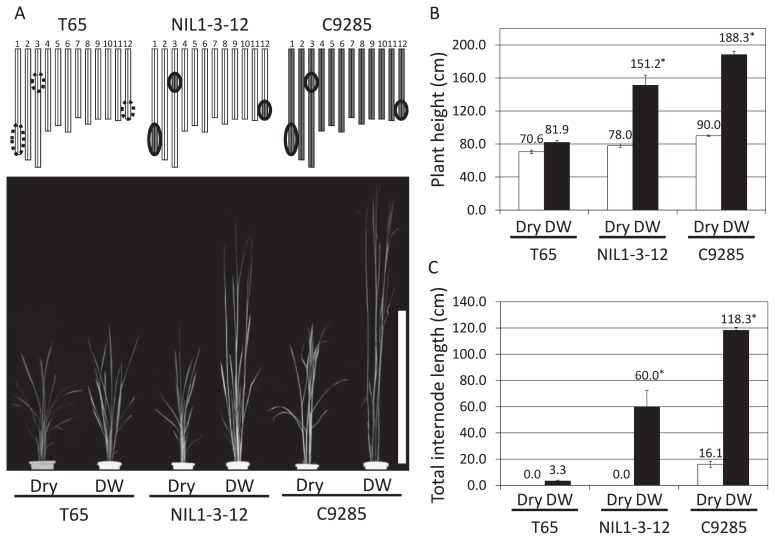
Fig. 1.
Phenotypic and quantitative evaluation of the deepwater response. (A) Deepwater response in T65, NIL1-3-12 and C9285. Circles represent positions of major QTLs. Scale bar = 1 m. White and black bars indicate T65 and C9285 chromosomes, respectively. Dry and DW indicate dry conditions (normally watered conditions achieved by irrigating perforated pots in approximately 3 cm of water) and deepwater conditions (approximately 160 cm of water), respectively. (B) Plant height as affected by deepwater conditions. (C) Total internode elongation. White and black bars indicate the total internode length under dry and deepwater conditions, respectively. Plants were submerged for two weeks. Data represents mean value ± SD (n = 5). Asterisks indicate significant differences determined using Student’s t test (P < 0.05).

