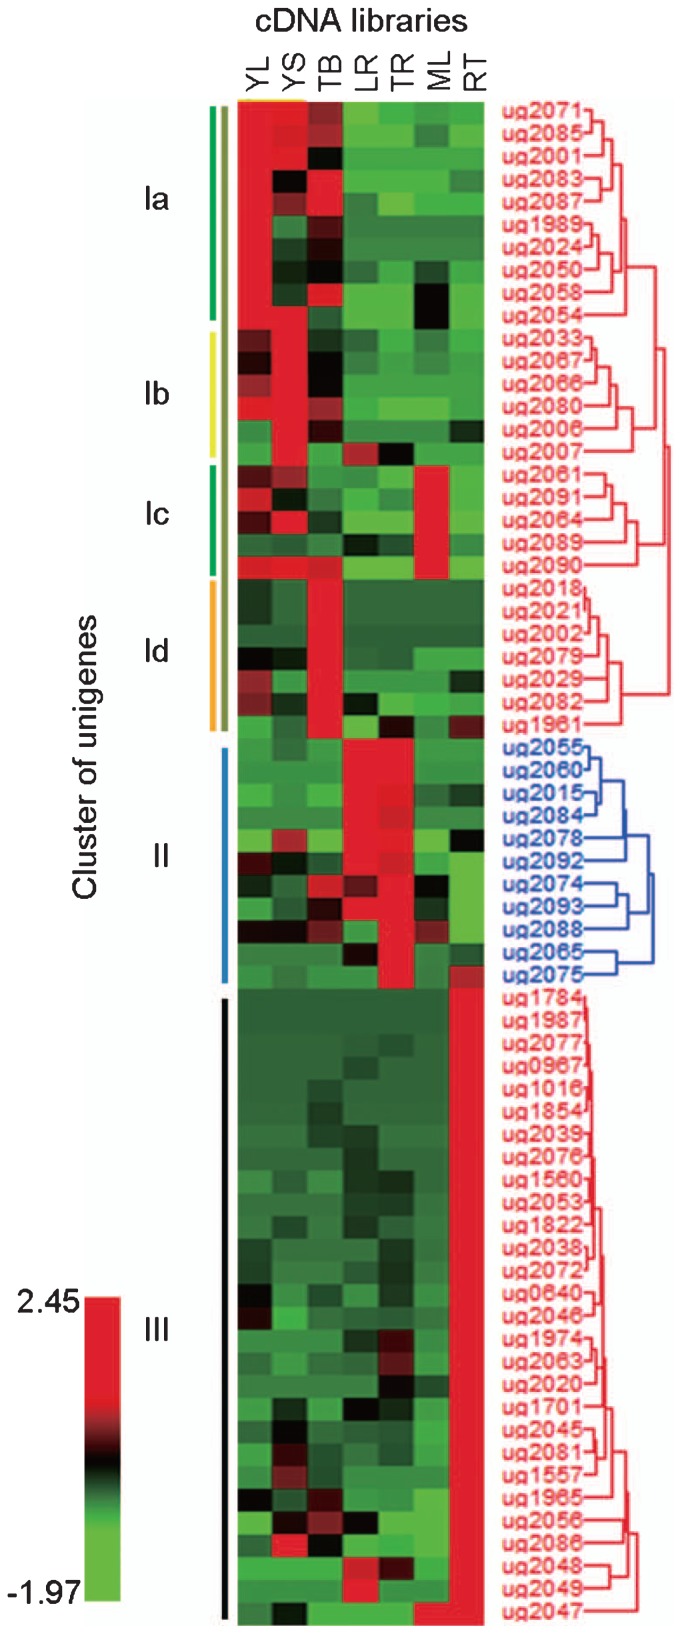
Fig. 2.
Hierarchical clustering of 67 unigenes showed differential expression among the seven cDNA libraries. These 67 unigenes were grouped into three major clusters (indicated by vertical color bars) and cluster I was further subdivided into four subclusters. Red bars represent normalized expression values greater than the mean for that gene; green bars represent lower expression than the mean.

