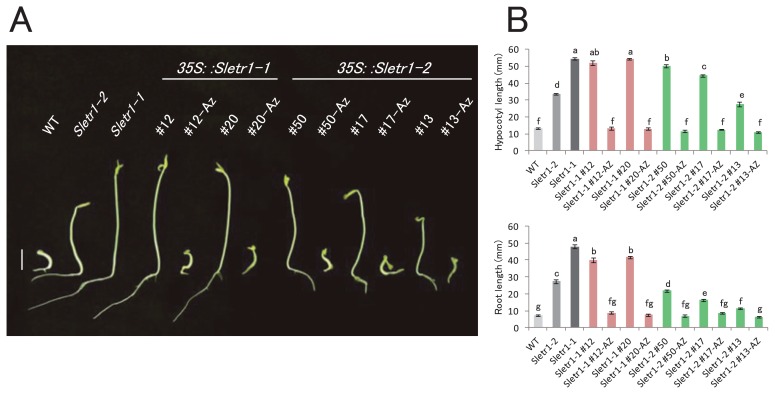
Fig. 2.
The ethylene response of transgenic lines in the T1 generation. (A) Triple response phenotype of the seedlings of wild type (WT), Sletr1-1, Sletr1-2 and transgenic lines. Seeds were surface sterilized and sown on 1/2 MS medium in the presence of 10 ppm C2H4 and incubated at 25°C in the dark for five days. Bar = 1 cm. (B) Quantification of ethylene-induced inhibition of root and hypocotyl growth. At least twenty seedlings of wild type, Sletr1-1, Sletr1-2 and T1 transgenic lines were measured, except for each azygous line (n > 3). Az represents the azygous plant of each transgenic line. Different letters between lines represent significant difference at P < 0.05, as determined by the Tukey-Kramer test. Vertical bars represent SE.

