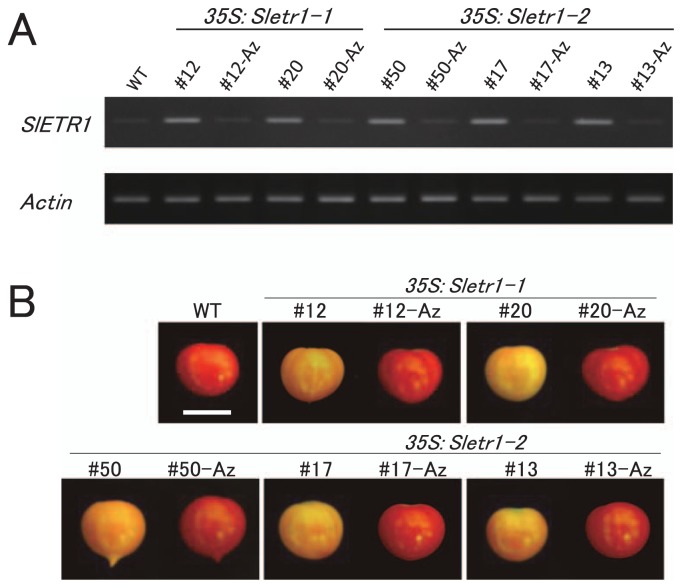
Fig. 3.
Expression analysis of SlETR1 gene and comparison of fruit ripening phenotype in T1 transgenic lines. (A) SlETR1 expression in leaves was investigated using semi-quantitative RT-PCR. Common region in the native SlETR1 and transgenes were amplified. Actin was used as an internal standard. Az represents the azygous plant of each transgenic line. (B) Fruit ripening phenotype of T1 transgenic lines. Fruits were harvested at 50 days after flowering. At least 3 fruits were evaluated in each line. Bar = 2 cm.

