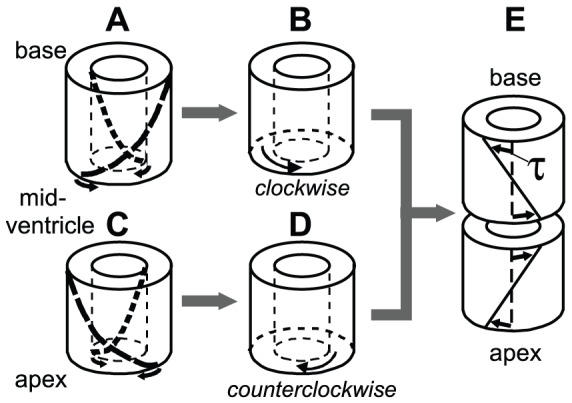
Figure 1. Relation between myofiber orientation and torsion.

 : At the base of the Situs Inversus Totalis (SIT) LV, myofibers follow a right-handed helical path at the sub-epicardium (A). Contraction of these myofibers, tends to rotate the midventricle in a clockwise direction with respect to the base, when viewed from the apex. The opposite is true for the sub-endocardium: myofibers follow a left-handed helical path, and contraction of these myofibers tends to rotate the midventricle in a counterclockwise direction with respect to the base (A). In general, a net clockwise rotation is measured at the base in SIT LV [6], indicating that epicardial myofibers dominate endocardial myofibers (B).
  : At the apex of the SIT LV, myofibers follow the same pattern as in the Situs Solitus (SS) LV. The dominant myofibers at the sub-epicardium follow a left-handed helical path (C). During contraction, a net counterclockwise rotation is measured in the apical region with respect to the midventricle of the SIT LV or with respect to the base in the SS LV (D). In fact, C and D both represent a whole SS LV. Finally, the torsion angle
  in SIT is similar to SS at the apex and inverted at the base (E).
