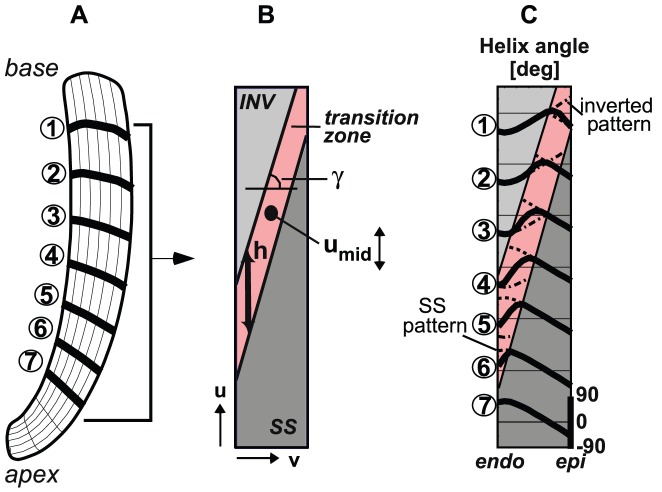
Figure 3. Initial myofiber orientation in SIT simulation MID.
A: Long-axis cross-section of LV mesh. B: Mapping of the cross-section in A on a rectangular domain used to describe the spatial distribution of myofiber orientations. The transition from a normal (SS) pattern at the apex to an inverted (INV) pattern at the base is described by parameters  (location of transition at midwall),
  (the slope of the transition between the endo- and epicardium), and
  (the height of the transition zone).
  is subject of variation in between the SIT simulations BASE, MID and APEX. C: Initial (before reorientation) transmural course of helix angle
  in simulation MID (solid) at the 7 levels indicated in A. In the transition zone, the courses of the SS (− −) and inverted pattern (−.) are presented. The transmural distribution of the transverse angle
  was set to zero.

