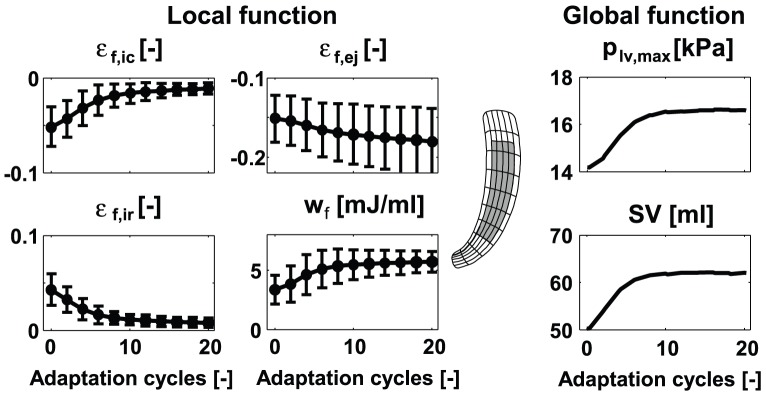
Figure 4. Evolution of local (left) and global (right) LV function in SIT simulation MID during the reorientation process.
Local function is presented by means and standard deviations (SD) of variables natural myofiber strain during isovolumic contraction  , during ejection
  , during isovolumic relaxation
  , and stroke work density
  . The values were calculated from the grey area indicated in the long-axis cross-section of the LV mesh (mid). Global function is presented by maximum LV pressure
  and stroke volume
  .
.

