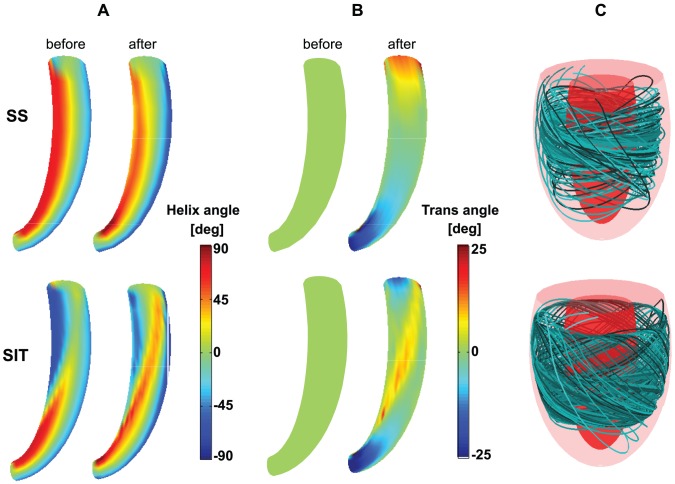
Figure 8. Structural results of simulation SS (top row) and SIT simulation MID (bottom row).
A: Helix angle  distribution on a long axis cross-section of the LV mesh before (left) and after (right) reorientation. B: Transverse angle
  distribution before (left) and after (right) reorientation. C: 3-D visualization of fiber paths through the LV mesh after reorientation. Ten paths are shown which started at different locations between endo- and epicardium. The color of the path refers to the starting point.

