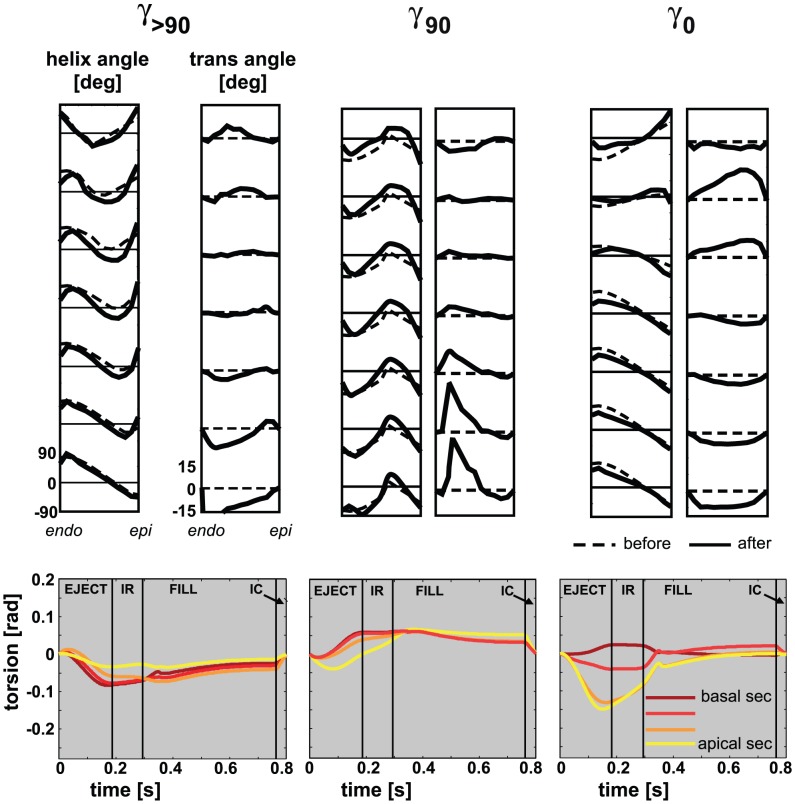
Figure 10. Results of additional simulations.
The additional simulations were performed with a variation on simulation MID (with  , see figure 3 for definition of
  ):
):  (
( ),
),  , and
, and  , where the subscript 90 and 0 refer to a
  of
of  and
and  , respectively. Top: Transmural distribution of
  and
and  before (− −) and after 15 adaptation cycles (−) at 7 levels between apex and base. Major pattern of
  remained closed to the initial distribution, while a non-zero distribution for
  developed. Bottom: Torsion patterns [rad] after 15 adaptation cycles. Amplitudes of torsion have decreased significantly after reorientation as compared to amplitudes before reorientation.

