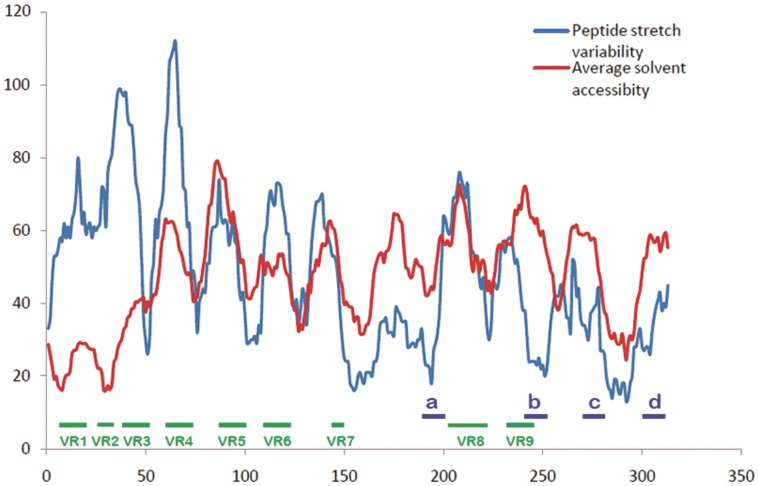
Figure 1. Comparison of solvent accessibility and stretch variability in rotaviral VP7 sequence database.
Comparative diagram between solvent accessibility and stretch variability shows the regions of lowest variability and greatest environmentally accessed. All nine variable regions documented from previous research are found clearly distinguishable through our graph. Those regions are marked in green line. Peptide regions (peptide-a, b, c & d) indentified by our method are marked by blue lines.

