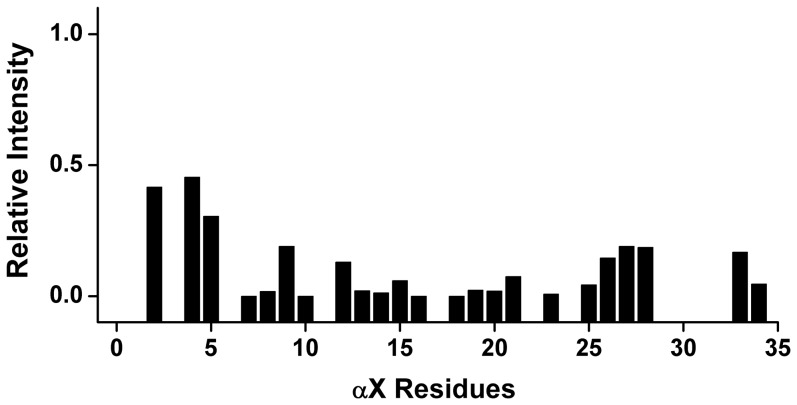
Figure 2. Localization of αX CT in DPC micelles by PRE.
A bar diagram showing ratio of intensity of NH/CαH correlation obtained from 1H-1H TOCSY spectra of αX CT in the absence and in the presence of 1 mM MnCl2. As can be seen, most of the residues of αX CT had experienced a marked quenching (low value in intensity ratio) in the presence of paramagnetic Mn2+, suggesting solvent exposure of the CT.

