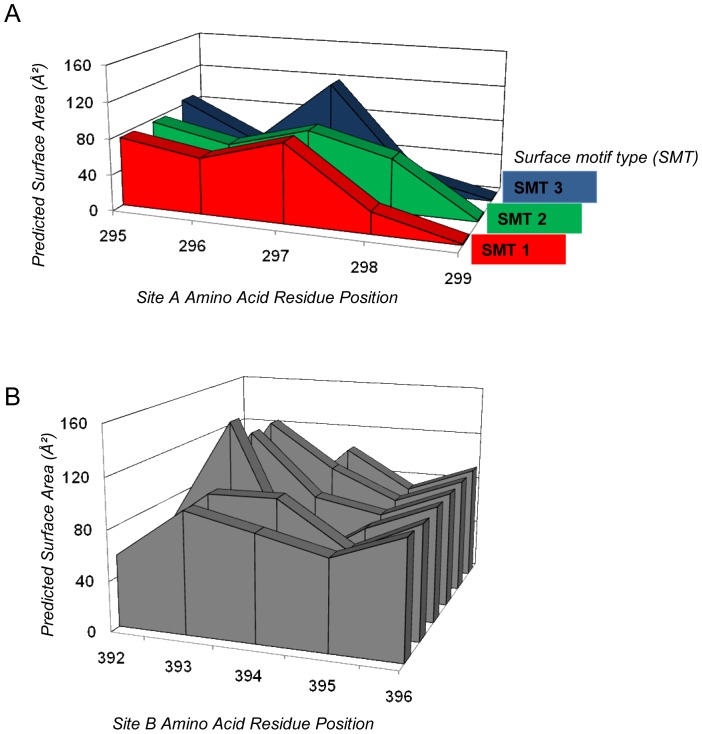
Figure 3. Predicted surface motif types (SMT) of (A) Site A motifs, and (B) Site B motifs.
Predicted surface area profiles were generated and the surface area values (Å2) of key amino acid residues were plot graphically. Similar profiles were grouped together as surface motif types. (A) Predicted surface motif types for Site A (amino acid residues 296–298) revealed three clusters of profile types: surface motif type 1 (red) detected 2000–2011; surface motif type 2 (green) detected 2004–2009; surface motif type 3 (blue) detected 2000–2011. (B) Predicted surface area profiles for Site B (amino acid residues 293–395) did not show definitive profiles, and surface motif types could not be defined from this data.

