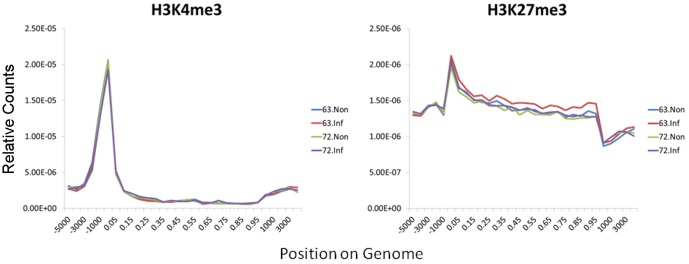
Figure 2. H3K4me3 and H3K27me3 enrichment density along chicken genome.
The enrichments of H3K4me3 and H3K27me3 modifications were respectively plotted around TSS (transcription start site), promoter region (from -5000 to TSS), the gene body region, TTS (transcription termination site) and intergenic region (from 3000 bp to TTS). We scaled a percentage of length instead of the true length to do the plotting to solve the problem of genes with different exon and intron length.

