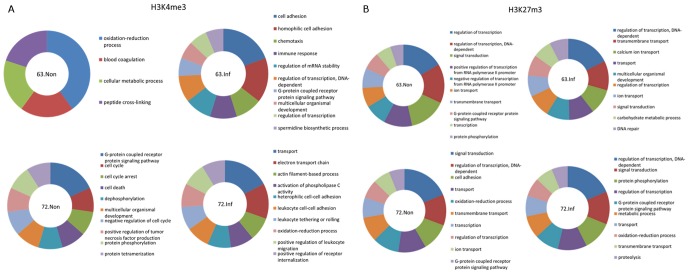
Figure 5. Gene functional analysis of the genes with unique histone modification islands in different groups.
A. Gene functional analysis of the genes with unique H3K4me3 islands by IPA. Except for Line 63 non-infected group, 10 enriched pathways were shown in figure. Larger size of the sector means this pathway is represented by more genes. 63.Non: Line 63 non-infected group; 63.Inf: Line 63 infected group; 72.Non: Line 72 non-infected group; 72.Inf: Line 72 infected group. B. Gene functional analysis of the genes with unique H3K27me3 islands.

