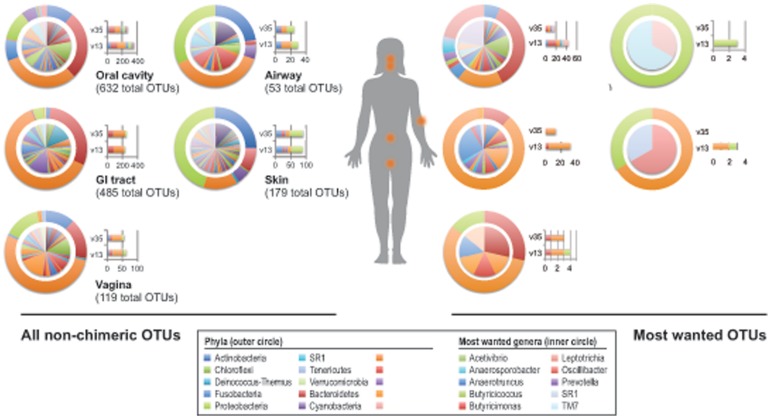
Figure 2. Body habitat distribution of non-chimeric and most wanted HMP OTUs.
The distributions of 1,468 non-chimeric HMP OTUs (left panel) and 119 most wanted OTUs (right panel) are shown as phyla (outer circle) and genera (inner circle) at each of the 5 sampled body habitats. Distribution profiles were based on the habitat in which the HMP OTU was found most frequently. Bar graphs illustrate the relative proportion of HMP OTUs from each 16S variable region, shown as phyla. Color codes for all phyla and ‘most wanted’ genera with more than one representative are shown in left and right figure legends, respectively.

