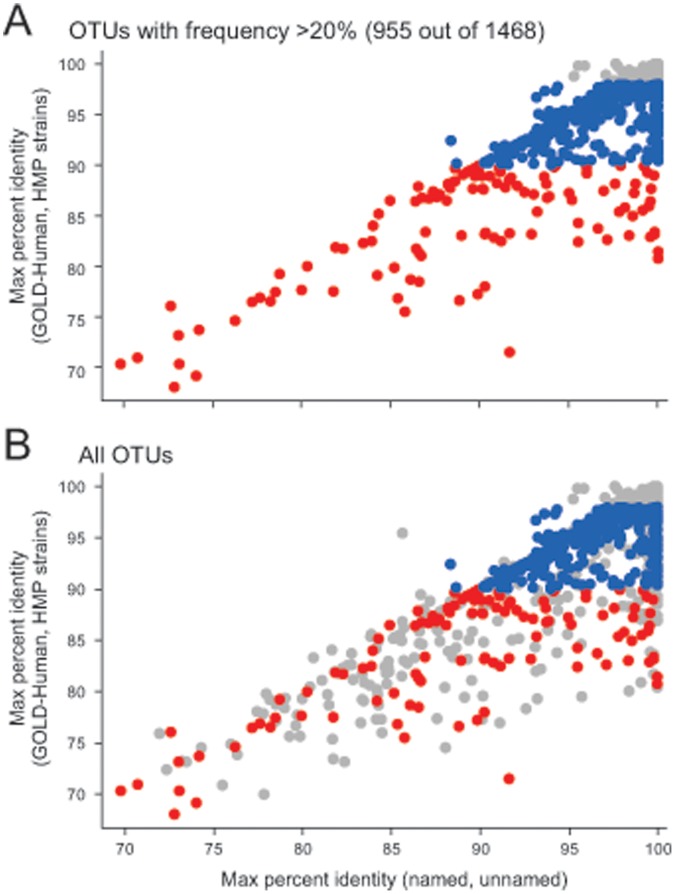
Figure 5. Nearly all sequenced taxa have been cultured but not all cultured taxa have been sequenced.
For each taxa, the percent identity from the best match to a human sequenced database (GOLD-Human or HMP-strains) versus the best match to a sequence database of cultured organisms (named or unnamed). The colors in all panels indicate assignment to priority groups for whole genome sequencing: red = highest priority, blue = medium priority, gray = low priority. (A) OTUs that are present in at least 20% of all samples in at least one body habitat; (B) all HMP OTUs.

