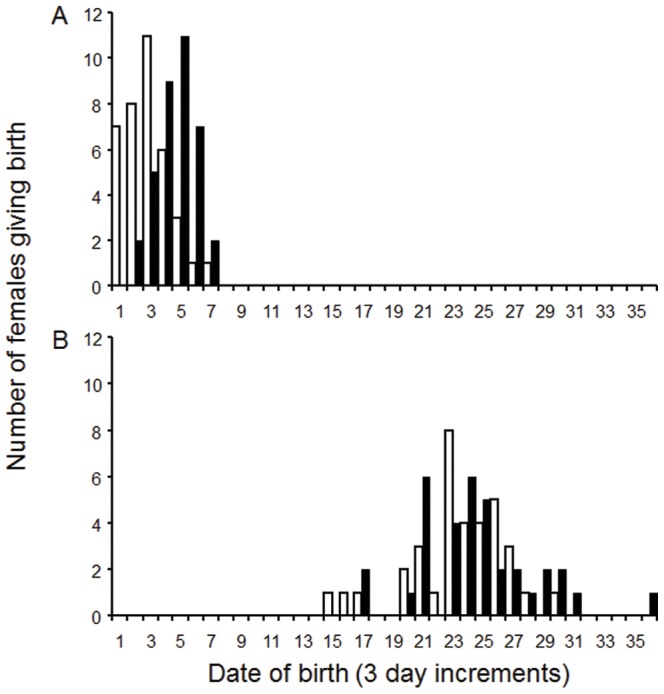
Figure 1. Frequency of births (3 day increments) for Pseudemoia entrecasteauxii.

White bars indicate high food availability during gestation, while black bars indicate low food availability during gestation. Graph A shows date of birth in offspring from females given extended basking availability during gestation. Graph B shows date of birth in offspring from females given restricted basking availability during gestation. Three day increments begin with the first recorded births on Dec 7 2007.
