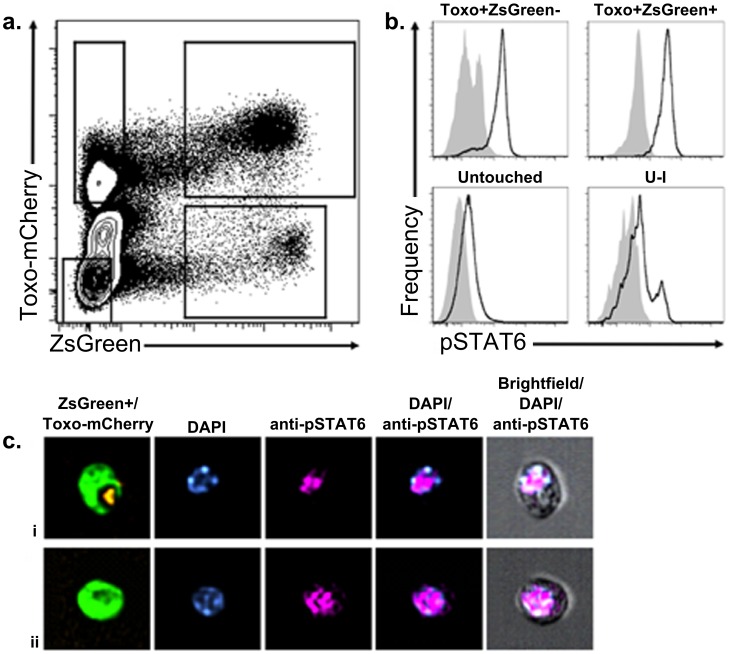
Figure 6. A subpopulation of uninfected-injected cells in vivo show phosphorylation and nuclear translocation of STAT6.
Cre-reporter mice were infected with 2×10⁶ tachyzoites of RH-mCherry-Cre parasites and sacrificed at 18–20 hpi. The PECs were removed and processed in the presence of phosphatase inhibitor, stained for dead cells using Live/Dead stain, fixed with 2% PFA, and permeabilized overnight in 90% methanol. Cells were then stained for pSTAT6 and analyzed by flow cytometry. (a) Representative contour plot of mCherry and ZsGreen fluorescence of live cells to allow gating of the Untouched, Toxo+ZsGreen−, Toxo+ZsGreen+, and uninfected-injected (U-I) cell populations. (b) Representative histograms of pSTAT6 staining in each population gated in (a). (c) Representative images of pSTAT6 localization in the nucleus (DAPI) of (i) Toxo+ZsGreen+ and (ii) U-I cells as determined by high throughput fluorescence imaging on the Amnis ImageStream X. n = 5 mice.

