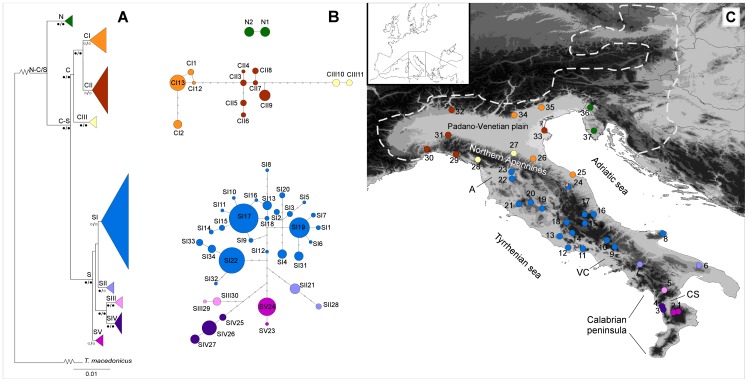
Figure 1. Geographic distribution of the 37 sampling sites and phylogenetic relationships of the 49 haplotypes found in Triturus carnifex.
A, Maximum likelihood (ML) tree showing the phylogenetic relationships among the 49 haplotypes found in Triturus carnifex. Terminal haplogroups were collapsed. Clade names and bootstrap (bs) values of ML and Maximum parsimony (MP) trees (ML/MP), respectively, are shown above and below each node (grey circles: bs >70%; black circles: bs >85%). B, Statistical parsimony networks, with haplotypes numbered as in Table 1. Circles size is proportional to haplotype frequency; open dots represent missing intermediate haplotypes. C, Geographical distribution of the 37 populations sampled. Populations (shown as pie diagrams) are coloured according to the main haplogroups in panels A and B. White dotted line shows the northern edge of the species' distribution; A, Arno river basin, CS, Crati–Sibari plain, VC, Volturno–Calore river drainage basin. Inset: Geographical location of the study area within the western Palearctic region.

