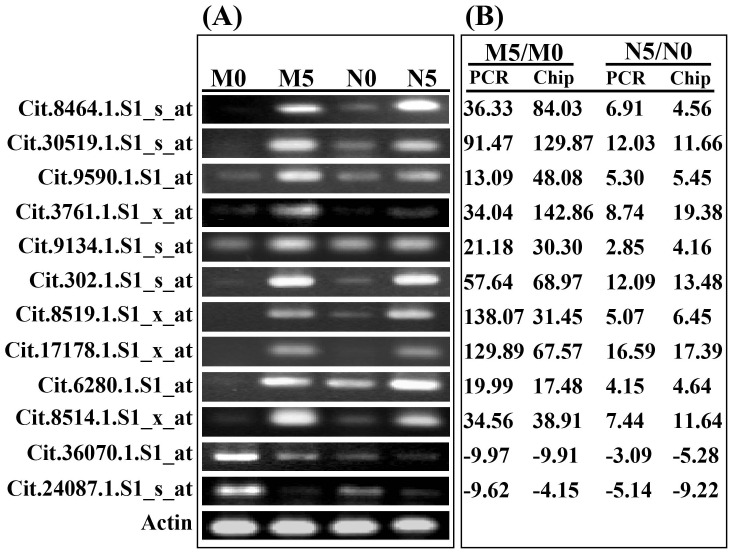
Figure 3. Verification of the microarray results by semi-quantitative RT-PCR.
(A) RT-PCR results of the genes. The cDNA of ‘Meiwa’ and ‘Newhall’ leaves sampled at 0 (designated as M0 and N0, respectively) and 5 (designated as M5 and N5, respectively) days post inoculation (DPI) was amplified with specific primers of the selected genes, using Actin as a control. (B) Comparison of the expression ratios (M5/M0 and N5/N0) between RT-PCR analysis and the microarray data. The expression ratios were calculated by quantifying the band density using the Quantity One software.

