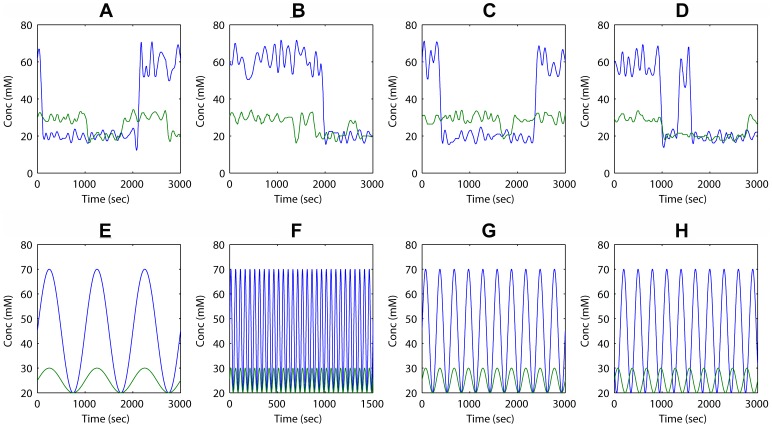
Figure 2. Time (sec) courses of external variations of concentrations (mM) of F (in blue) and T (in green).
The first four courses a–d (A–D) are taken from figure 4 of [17] labeled as I, II, III and IV. The other four courses e–h (E–H) are obtained through the following sinusoidal equations:  and
and  , where a1 and a2 are the amplitudes, t is the time, T the period, ϕ the phase and minF and minT are the minimum values of F and T. The first two (e and f) differ in their period but have the same phase (ϕ = 0); course e presents a high period (T = 1000) while course f presents a lower one (T = 50). The two last sinusoidal courses (g and h) differ from each other in phase (for course g, ϕ = 0 and for course h, ϕ = 10) and from the other two in period (T = 300). The concentrations of the reservoir species F and T vary within two regimes. For F centred at 60 mM and 30 mM and for T at 30 mM and 20 mM.

