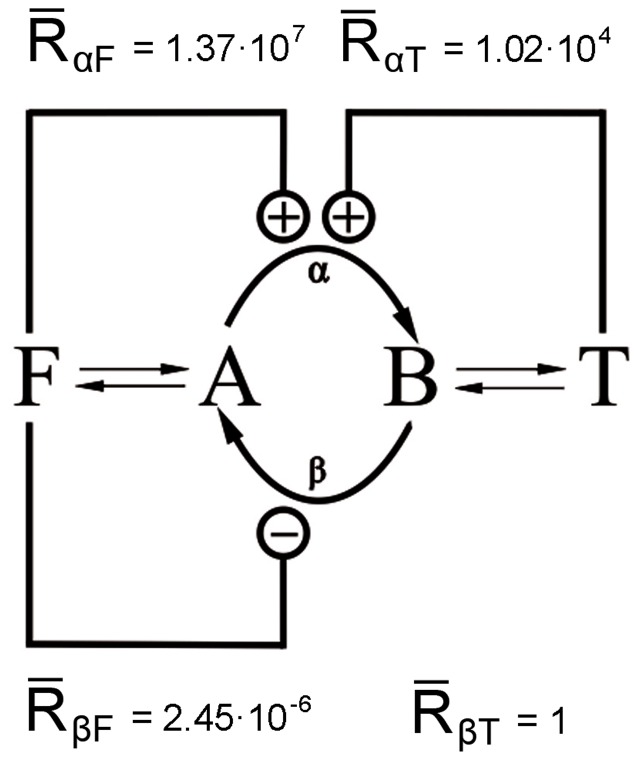
Figure 6. Resulting regulation scheme drawn from the consensus set of parameters.
Enzyme α is activated by both effectors F and T ( and
and  ) whereas enzyme β is inhibited (
 ) by F and T has no effect on it (
 ). The corresponding optimized parameters are: Kα,F = 1.5·10−2, Kα,T = 5.5·103, Kβ,F = 9.2·10−8, Kβ,T = 3.7·107, rα,F = 1.9·107, rα,T = 2.3·109
,
rβ,F = 1.6·10−7
,
rβ,T = 3.65.

