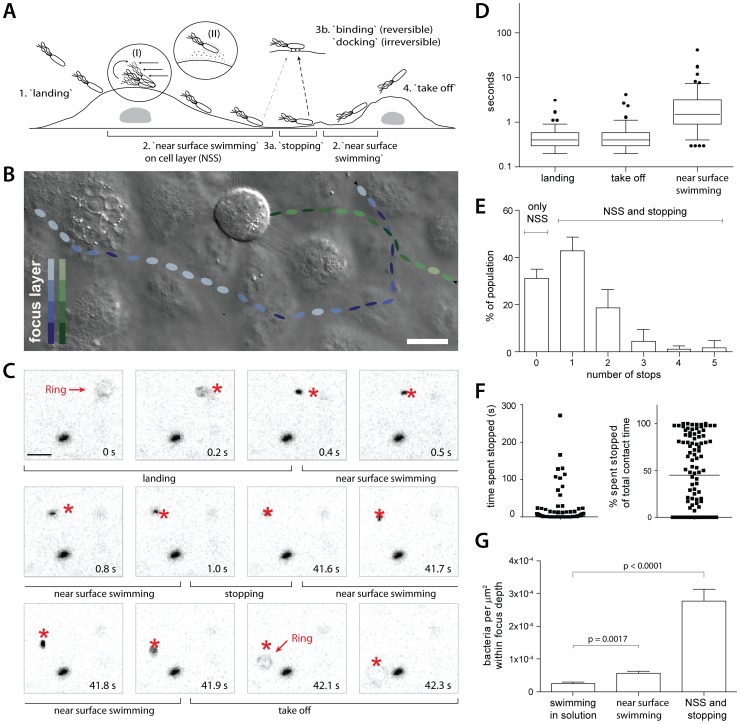
Figure 1. Near surface swimming of S. Typhimurium on cellular surfaces.
(A) Scheme describing the four stages of S. Typhimurium movement observed at cellular surfaces. Inserts (I) and (II) indicate two possible mechanisms for trapping S. Tymphimurium in proximity to the surface: hydrodynamic entrapment (I) and DLVO interactions (II), respectively. A “stop” on the surface can be due to an obstruction hindering the path of the bacterium (3a) or reversible binding/irreversible docking (3b), see text for details. (B) Snapshot of a movie acquired using DIC imaging. HeLa cells were infected with S.TmΔ4 and the interactions of bacteria with cells were followed in real time. The tracks of 2 representative S.TmΔ4bacteria are indicated, their estimated positions in the Z- layer while moving along the cellular surface are indicated by the shade of color. The bacterium indicated in green encounters a mitotic cell and stops until the end of the movie while the bacterium indicated in blue crosses and leaves the field of view. Compare supplementary Videos S1 and S2. Scale bar: 18 µm. (C) HeLa cells were infected with S.TmΔ4(pGFP) and 5-minute fluorescence microscopy movies were acquired. Representative frames illustrating key stages of S. Typhimurium NSS and our quantification strategy are depicted (see text as well as Materials and Methods for details). In each frame, the star indicates the position of the corresponding bacterium in the previous frame. Note the fluorescent ring in time points 0 s and 42.1 s, indicating the start (“landing”) and end (“take off”) of the contact with the host cell. (D) Quantitative analysis of the different stages of NSS (see A and C) for S.TmΔ4(pGFP). 5 independent experiments were analyzed (n = 122 bacteria). The box plot represents the median, interquartile range, the 5%–95% range as well as outliers. (E) Quantification of the fraction of S.TmΔ4(pGFP) making no stops (“NSS only”), or the fraction making the indicated number of stops on the cell surface during NSS (“NSS and stopping”; further analysis of the experiment in D). Error bars:standard deviation. (F) Quantitative analysis of the time a bacterium spends stopped at the surface. The data is plotted either in seconds (left panel) or as a fraction of the total contact time of the respective bacterium (right panel; further analysis of a subset of the experiment in D). (G) HeLa cells were infected with S.TmΔ4(pGFP) and 5-minute fluorescence movies were acquired focusing either >100 µm above the cells (“swimming in solution”) or on the cell layer. For 40 time points from 2 independent experiments the number of S.TmΔ4(pGFP) in a field of view was quantified. Either the whole population (“NSS and stopping”) or only moving bacteria (“NSS”, immotile bacteria excluded) were counted. **: p<0.01; ***: p<0.0001.

