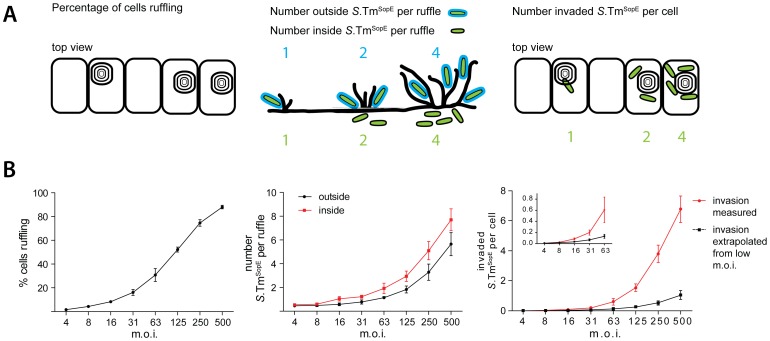
Figure 10. Cooperative invasion at membrane ruffles.
(A) Scheme explaining our quantification strategy for cooperative invasion. (B) HeLa cells were incubated with S.TmSopE(pGFP) at the indicated m.o.i. for 9 min, followed by washing, fixation and staining of actin and extracellular bacteria (anti-LPS antibody; staining before permeabilization). Left panel: quantification of the fraction of cells carrying ruffles. Middle panel: quantification of the number of “inside” and “outside” S.TmSopE(pGFP) per individual ruffle. Right Panel: number of invaded S.TmSopE(pGFP) per cell, calculated by multiplying the number of intracellular bacteria per ruffle with the fraction of ruffling cells. The black line indicates the estimated number of invaded S.TmSopE(pGFP) assuming independent invasion events, extrapolated from experimental data of ruffles with only one associated bacterium at the lowest m.o.i.. Each data point summarizes 4×150 cells for the analysis of cellular ruffling and 4×25 cells for inside and outside bacteria from 2 independent experiments. Error bars: standard deviation.

