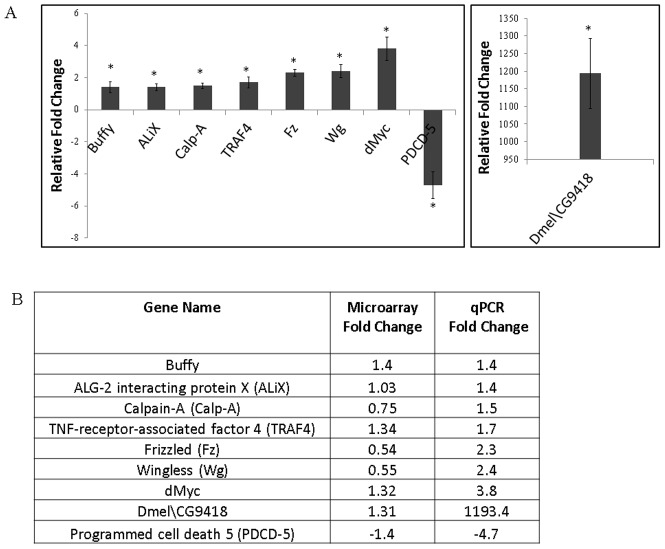
Figure 4. Quantitative RT-PCR validation of selected apoptosis related genes identified by microarray analysis.
(A) Histogram showing relative fold change in expression level of apoptosis related target genes in flies expressing dTip60E431Q A. Staged second instar larvae were used for cDNA preparation. RT-PCR reactions were carried out in triplicate and the fold change was calculated using the 2−ΔΔCT method using RP49 as control. (B) List of selected apoptosis related target genes identified by microarray analysis and validated in the dTip60E431Q A line using quantitative RT-PCR.

