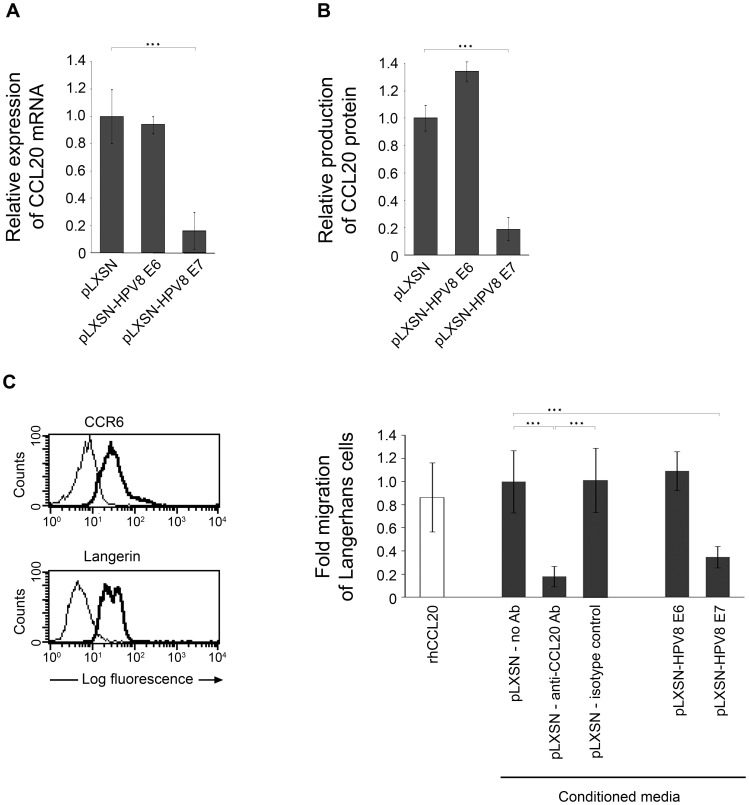
Figure 7. HPV8 E7 suppresses CCL20 expression and Langerhans cell migration.
CCL20 mRNA (A) and protein (B) levels were quantified in NHK stably expressing HPV8 E6 (pLXSN-HPV8 E6) or E7 (pLXSN-HPV8 E7) oncogenes. The amount of CCL20 mRNA (in relation to β-actin as measured by quantitative real-time PCR) or protein in control cells was set at 1. CCL20 protein levels in supernatants collected from E6 or E7 expressing keratinocytes and corresponding control cells (pLXSN) were determined by ELISA. Measurements represent the mean values from three independent retroviral infections ± SD. Asterisks represent statistical significance, p<0.001. (C) Migration of langerin- and CCR6-positive (left panel) Langerhans cells was assessed in response to conditioned media collected from pLXSN control NHK in the presence or absence of anti-CCL20 antibody (Ab) or respective isotype control Ab and from NHK stably expressing HPV8 E6 (pLXSN-HPV8 E6) or E7 (pLXSN-HPV8 E7) oncogenes (right panel). Recombinant human CCL20 (rhCCL20) was used as a positive control. After 24 h transmigrated cells were counted. Data were collected in triplicates from at least two independent experiments using conditioned media from two independent retroviral infections. Shown are the mean values ± SD. Asterisks represent statistical significances, p<0.0001.

