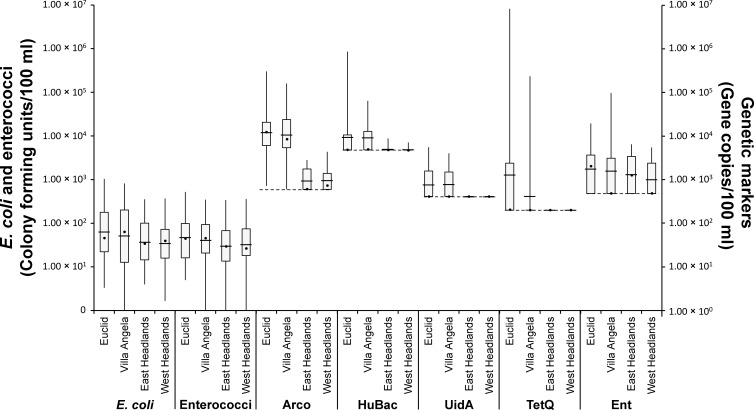
Fig 1.
Box plots showing geometric means and medians of E. coli, enterococcus, and genetic marker levels at four Lake Erie beaches. The length of each box shows the interquartile range and 50% of cases of the variable. The line and the dot in the box indicate the geometric mean and the median, respectively, while extended lines from the box show maximum and minimum values.

