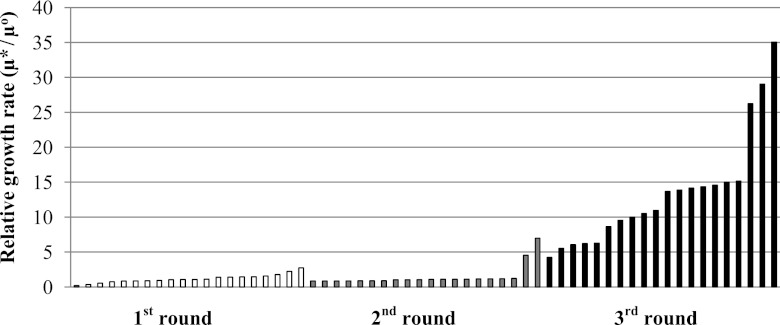
Fig 1.
Comparison of the relative growth rates of isolated mutants (selected). The growth rates of strains isolated during the first (white bars), second (gray bars), and third (black bars) rounds of mutagenesis (μ*) were compared to those of the wild type (μ°). Twenty representative strains are shown out of the 40 tested for each round. The average growth rate of these isolated mutants increased progressively with the round of mutagenesis. The isolated strain with the highest growth rate in each round was selected.

