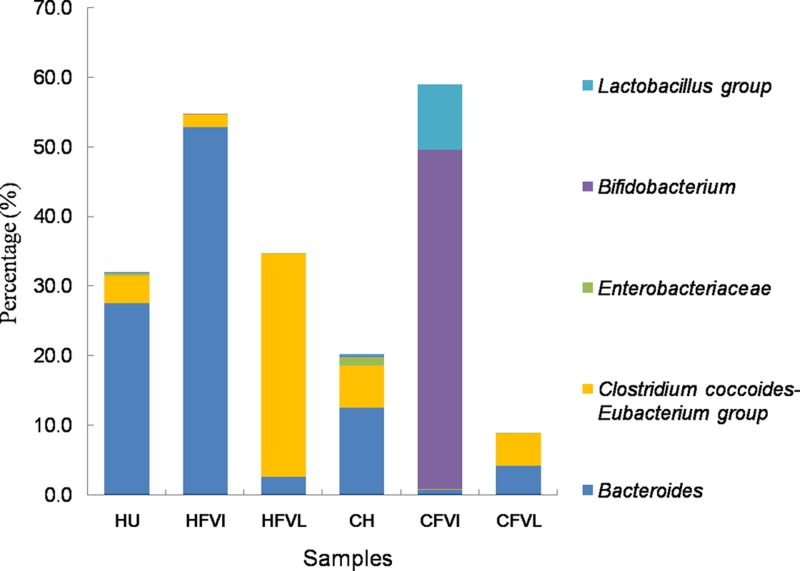
Fig 1.
Relative abundances of major bacterial groups in human and chicken microbiotas and their corresponding chemostat samples. Data are presented as the percentages of the total bacterial population made up by each bacterial group, as assessed by qPCR. The results are given as the means of measurements from three individual human (HU) and three chicken (CH) gut microbiotas and their chemostat products in VI (HFVI and CFVI) and VL (HFVL and CFVL) media.

