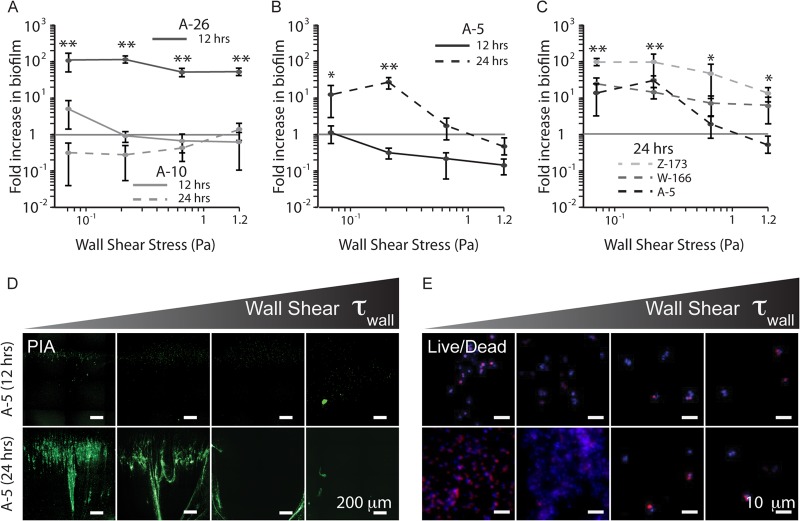
Fig 3.
Fluid flow results in differential biofilm formation among clinical isolates. (A) Strain A-26 forms strong biofilms under all shear stresses, whereas A-10 is unable to form biofilms under any shear after 24 h. (B) Strain A-5, after a lag phase of at least 12 h, forms significant biofilm when exposed to fluid flow and shear, with the most biofilm at 0.26 Pa. (C) Strains W-166 and Z-173 are able to form biofilms under a broader range of flow rates than A-5. (D) WGA staining of the biofilm matrix for A-5 after 12 and 24 h of culture under flow. (E) Live/dead staining of the same time points from panel D, showing live cells present on the channel surface after 12 h. These cell numbers drastically increase after 24 h. One asterisk indicates a P value of <0.01 and two asterisks indicate a P value of <0.005 measured against 1. Green, PIA; blue, DAPI; red, EtHDI.

