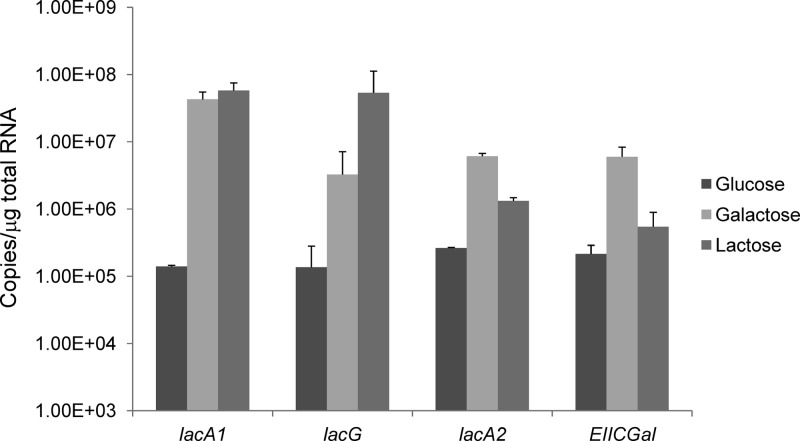
Fig 3.
Expression levels of the lacA1, lacG, lacA2, and EIICGal genes in cells grown on the indicated carbohydrates. Real-time quantitative RT-PCR was used to measure the transcript levels of each gene in DL1 cells grown in TV medium containing 0.5% glucose, galactose, or lactose. Results are the averages of data from three independent experiments, and the error bars represent standard deviations.

