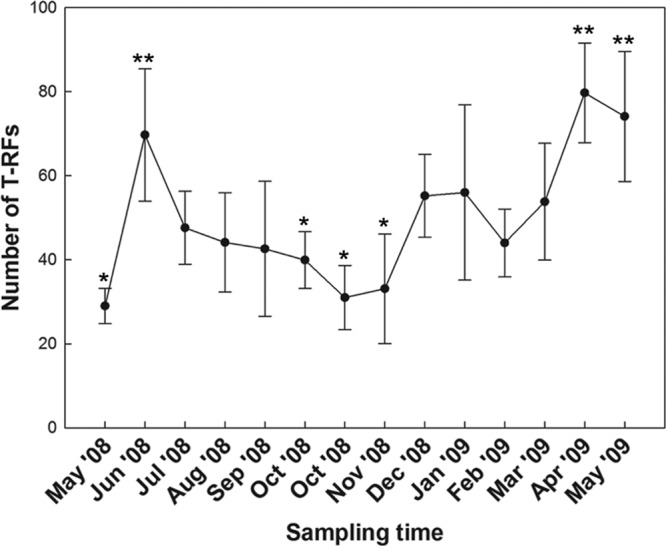
Fig 3.

Number of terminal restriction fragments over a 1-year sampling period (May 2008 to May 2009). Vertical bars associated with means represent the standard deviations across the five sample sites. Means denoted with single asterisks differ (P ≤ 0.05) from means indicated by double asterisks.
